Open Analytics
Ask participants to complete a task on your prototype or website and self-report when they believe they’ve finished. Open Analytics helps you find friction points, validate interactions, and measure usability.
Open Analytics
Ask participants to complete a task on your prototype or website and self-report when they believe they’ve finished. Open Analytics helps you find friction points, validate interactions, and measure usability.


Research objective
What is Open Analytics?
Open Analytics is a remote, unmoderated usability testing method where participants freely navigate a website or prototype and self-report when they feel they’ve completed a task. It is a flexible way to uncover friction points, measure ease of use, and gather both formative and summative insights across different design stages.

Test new
features
Test new
features
Test new
features

Optimize micro
interactions
Optimize micro
interactions
Optimize micro
interactions

Validate early
design ideas
Validate early
design ideas
Validate early
design ideas

Usability
testing
Usability
testing
Usability
testing

Refine features
with data
Refine features
with data
Refine features
with data

Track
user path
Track
user path
Track
user path
How to use it
On the Useberry platform
How to use it
On the Useberry platform
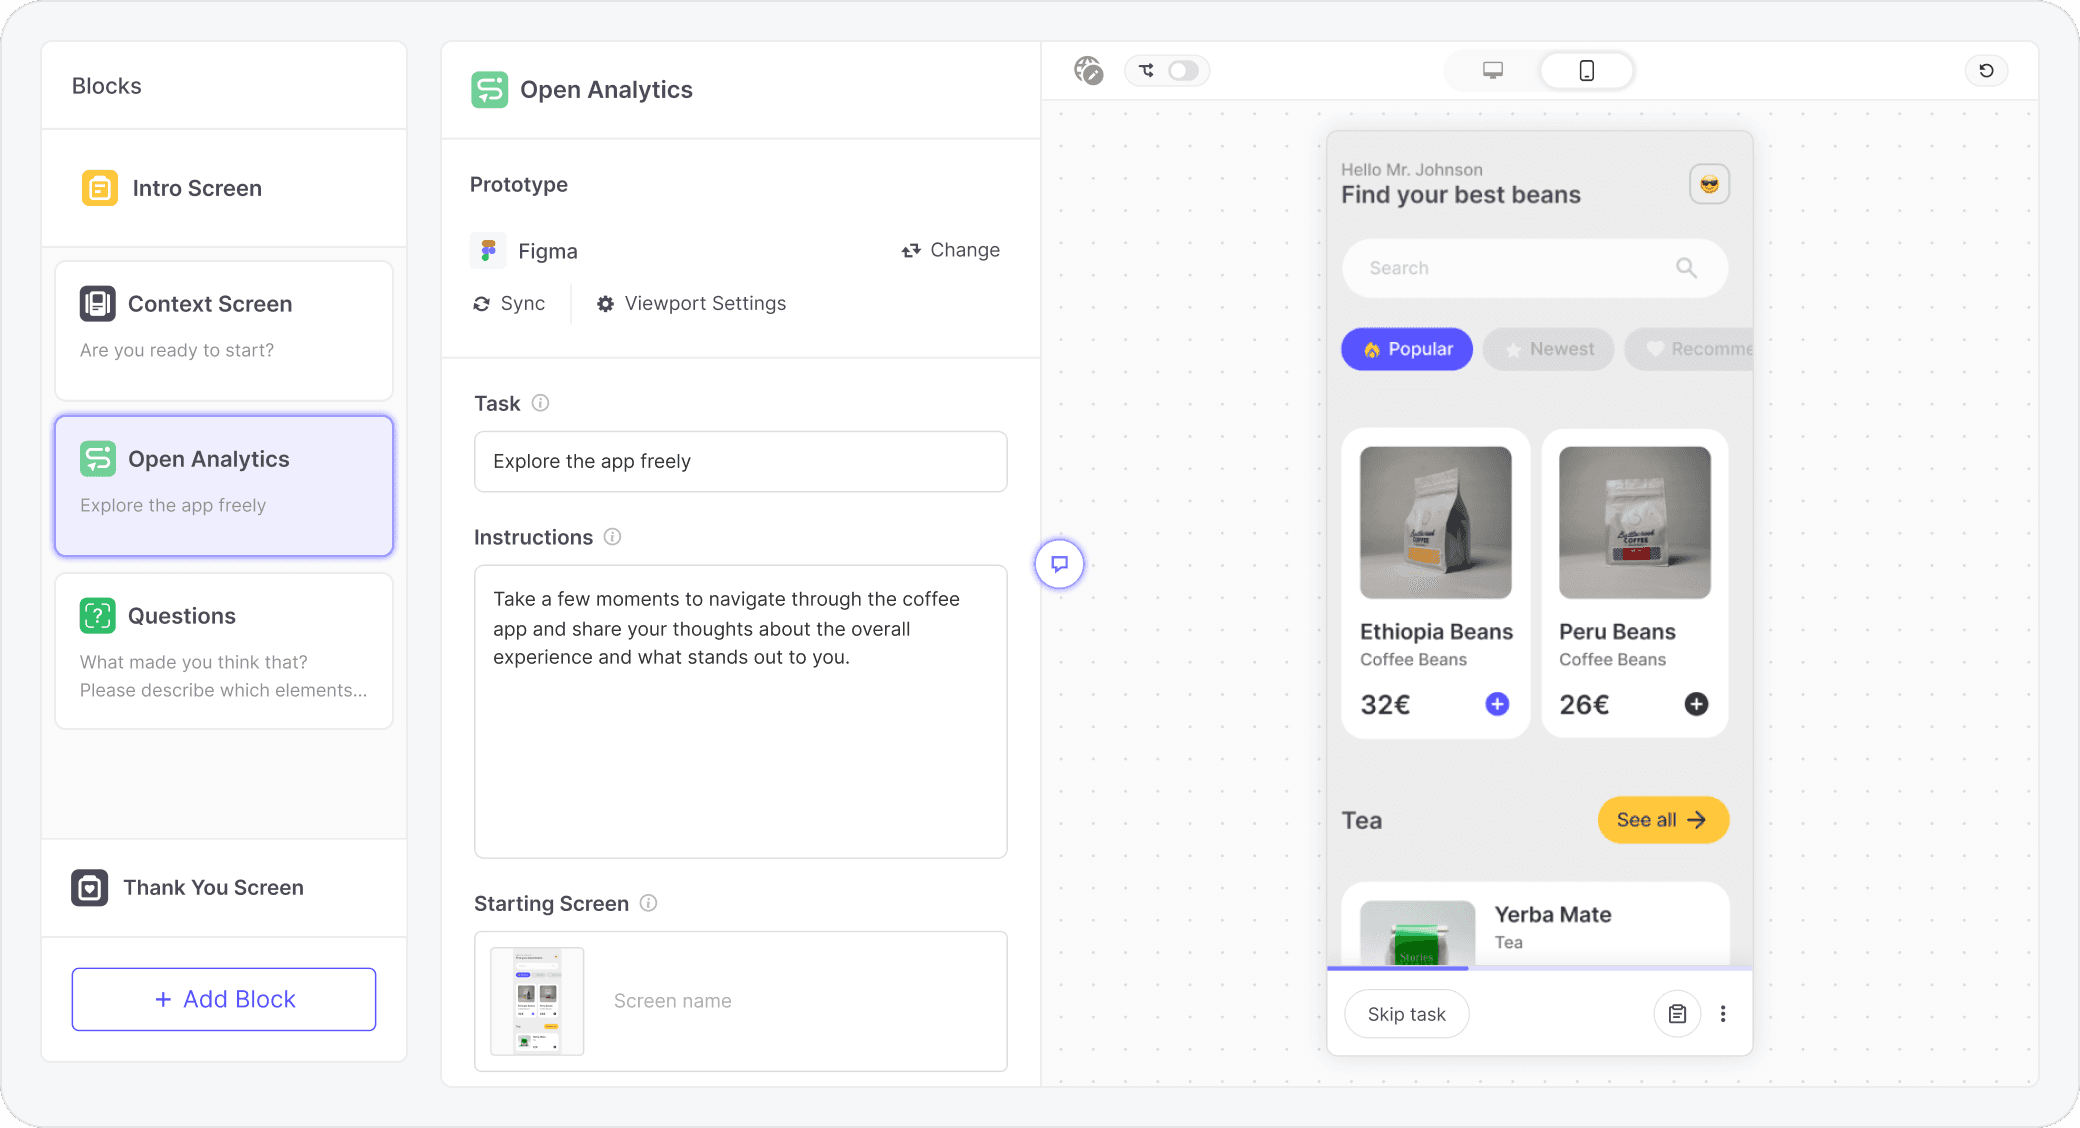
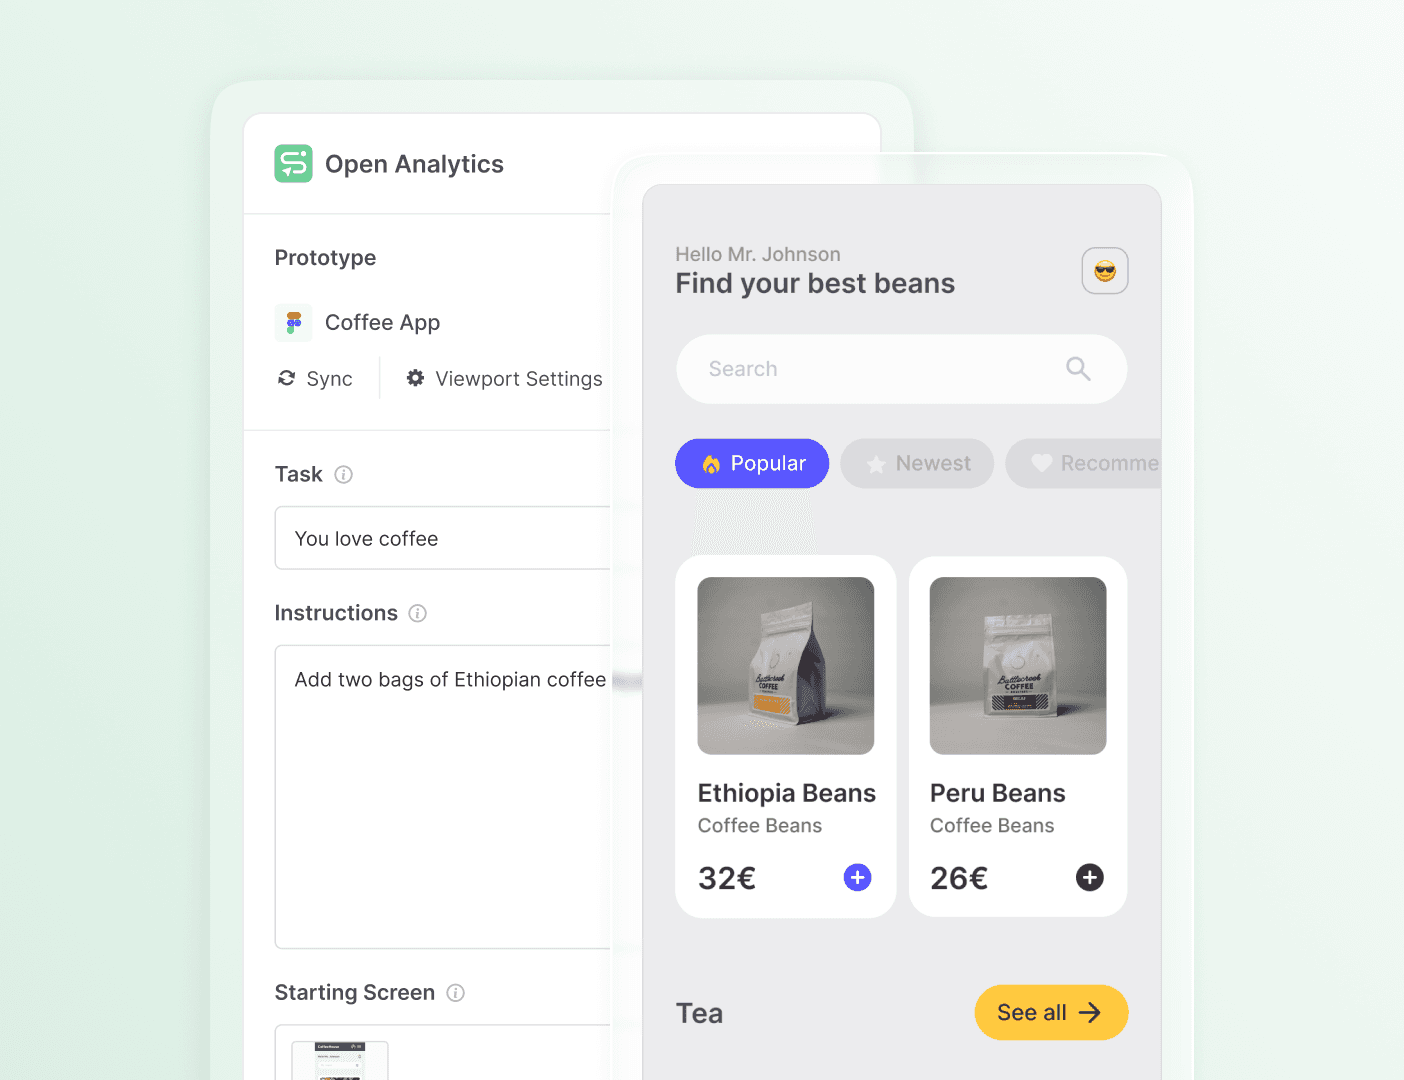
1 • Create
Add your prototype or website
Set the task participants need to complete. With Open Analytics, participants freely navigate until they feel they’ve finished the task, letting you see how users naturally interact with your product.
Get insights quickly:

1 • Create
Add your prototype or website
Set the task participants need to complete. With Open Analytics, participants freely navigate until they feel they’ve finished the task, letting you see how users naturally interact with your product.
Get insights quickly:
1 • Create
Add your prototype or website
Set the task participants need to complete. With Open Analytics, participants freely navigate until they feel they’ve finished the task, letting you see how users naturally interact with your product.
Get insights quickly:
2 • Share
Distribute your study to the right participants
Recruit from Useberry’s Participant Pool or share a link with your own audience. Manage recruitment from our unified dashboard to ensure clarity and speed.
Recruitment options:

2 • Share
Distribute your study to the right participants
Recruit from Useberry’s Participant Pool or share a link with your own audience. Manage recruitment from our unified dashboard to ensure clarity and speed.
Recruitment options:
2 • Share
Distribute your study to the right participants
Recruit from Useberry’s Participant Pool or share a link with your own audience. Manage recruitment from our unified dashboard to ensure clarity and speed.
Recruitment options:

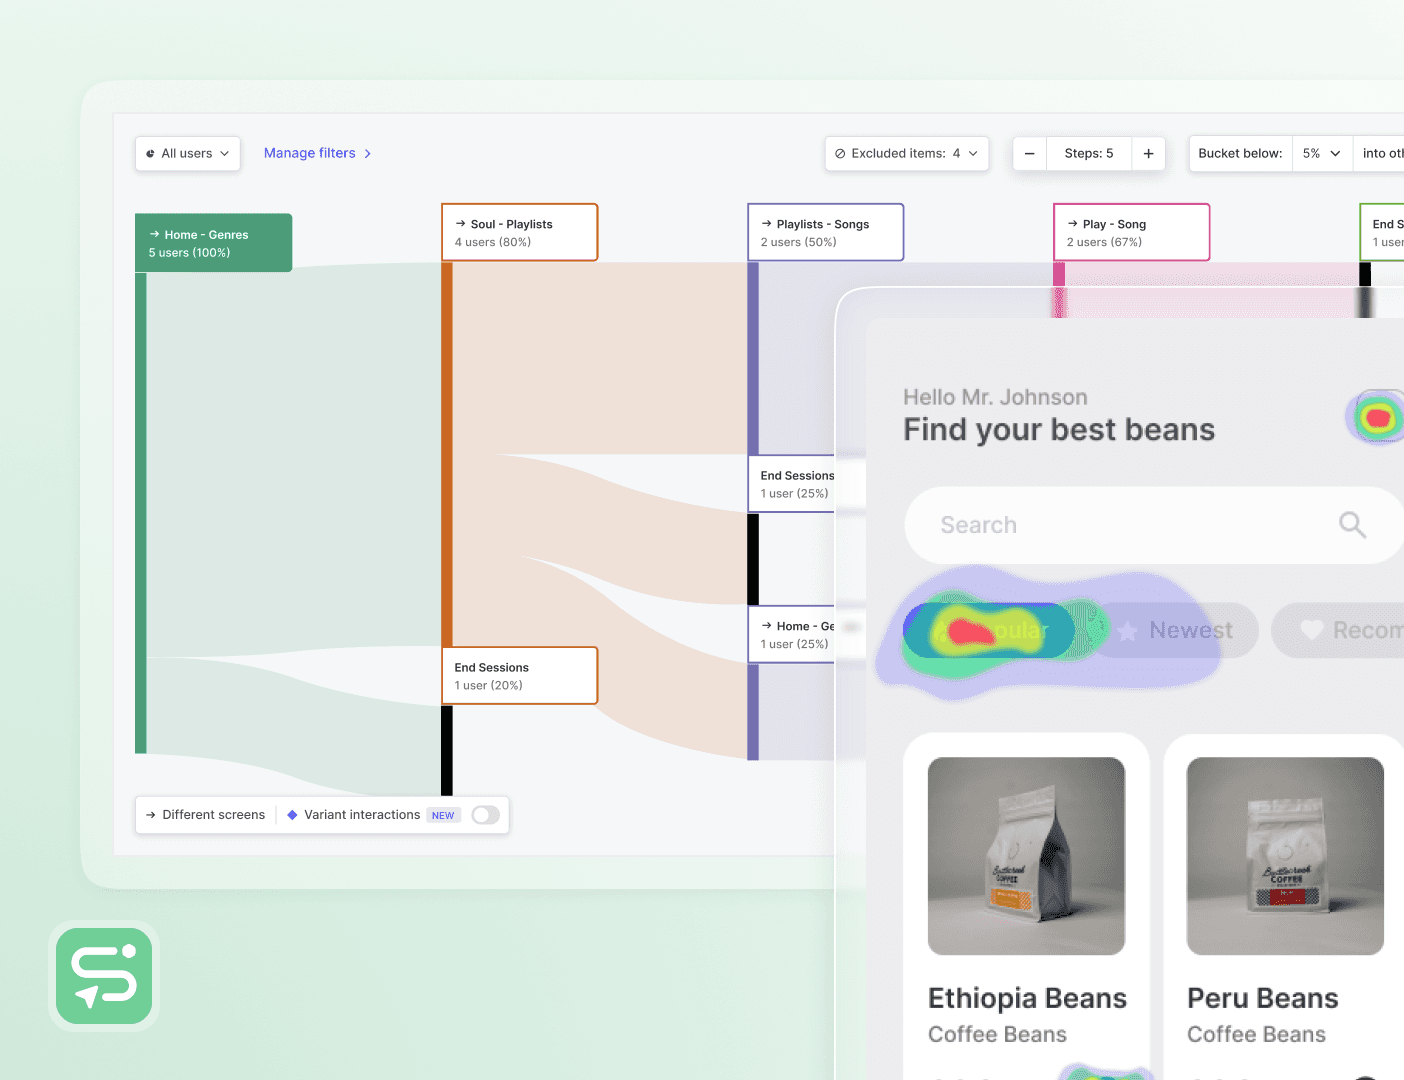
3 • Results
Track real user behavior
Explore real user paths and discover how participants approached the task. Open Analytics combines click tracking, user flows, and recordings so you can validate journeys, spot friction points, and refine your product with confidence.
Get insights quickly:


3 • Results
Track real user behavior
Explore real user paths and discover how participants approached the task. Open Analytics combines click tracking, user flows, and recordings so you can validate journeys, spot friction points, and refine your product with confidence.
Get insights quickly:
3 • Results
Track real user behavior
Explore real user paths and discover how participants approached the task. Open Analytics combines click tracking, user flows, and recordings so you can validate journeys, spot friction points, and refine your product with confidence.
Get insights quickly:

Useberry has transformed our testing process with its fast setup, effortless collaboration, and actionable insights. Features like randomization and granular metrics have helped us quickly validate designs and make confident, data-driven decisions. It’s an essential tool in our workflow.
Nurgül Aksoy
Senior Product Designer, Mews
Create experiences users love
Understand what works, fix what doesn’t, and keep improving.
No credit card required
Create experiences users love
Understand what works, fix what doesn’t, and keep improving.
No credit card required
Create experiences users love
Understand what works, fix what doesn’t, and keep improving.
No credit card required
Results & Analysis
Copyright ©2026 Useberry. All rights reserved.
Results & Analysis
Copyright ©2026 Useberry. All rights reserved.
Results & Analysis
Copyright ©2026 Useberry. All rights reserved.